Navigating the AIOps Career Path: Core Competencies, Tools, and Engineering Frameworks
 Introduction
Modern enterprise IT environments generate massive volumes of operational data every second. Systems produce logs, metrics, traces, and events across hybrid clouds, microservices, and legacy infrastructures. Traditional monitoring tools struggle to process this volume, leaving site reliability engineers (SREs) and IT operations teams overwhelmed by alert noise and fragmented visibility.
Designing a robust AIOps architecture solves this challenge by applying machine learning, data processing pipelines, and automated workflows directly to operational data. Instead of reacting to isolated alerts, an intelligent architecture correlates signals, identifies underlying anomalies, and assists engineers in resolving incidents before they impact end users.
Whether you are evaluating modern platform capabilities, building an internal observability pipeline, or exploring resources on platforms like TheAIOps.com, understanding the structural layers of Artificial Intelligence for IT Operations is critical. This guide breaks down the core layers, integration workflows, and design considerations necessary to engineer an effective AIOps architecture.
Understanding the Core AIOps Concept
At its core, Artificial Intelligence for IT Operations (AIOps) combines big data processing, machine learning (ML), and automation to enhance IT operations. Rather than replacing traditional monitoring, AIOps transforms raw operational outputs into actionable intelligence.
Traditional IT monitoring relies on static thresholds. For example, a system might trigger a Critical alert whenever CPU utilization exceeds 85%. In a modern dynamic cloud environment, short spikes in resource usage are often normal. Static rules lead to alert fatigue, where engineers spend hours sifting through duplicate notifications to find the actual root cause of a service disruption.
An AIOps architecture addresses this by acting as an intelligent analytical layer above your telemetry collection systems. It ingests telemetry from multiple disconnected tools, standardizes the incoming streams, filters out noise, and uncovers non-obvious relationships across complex software stacks.
The Functional Layers of an AIOps Architecture
A complete AIOps architecture consists of five functional layers working sequentially to transform raw operational telemetry into automated, safe operational outcomes.
1. Data Ingestion & Storage Layer
An AIOps system must collect operational data from across the entire technology stack. This layer relies on stream processing engines (e.g., Apache Kafka, Vector, or FluentBit) and specialized data stores.
- Metrics: Time-series numerical data measuring performance over time (e.g., CPU, memory, request rates).
- Logs: Timestamped unstructured or semi-structured text entries generated by applications and servers.
- Traces: Distributed request journeys through microservices, showing latency across boundary hops.
- Topology & Metadata: Real-time relationships between infrastructure, containers, network devices, and applications.
- Change Events: Deployment logs, CI/CD pipeline triggers, configuration updates, and feature flag toggles.
2. Data Processing & Standardization Layer
Raw data arrives in fragmented formats. The processing layer cleans, structures, and enriches data in real time:
- Deduplication: Merging identical log messages or duplicate alert signals sent from multiple agents.
- Enrichment: Attaching business context, network topology, region tags, or deployment metadata to incoming metrics and logs.
- Sensitive Data Masking: Redacting personally identifiable information (PII) or credentials before analytics algorithms process the logs.
3. Analytics & Machine Learning Engine
This layer represents the core analytical engine of the architecture. It applies algorithms to find patterns across normalized data streams:
- Anomaly Detection: Establishing dynamic baselines for normal system behavior and detecting deviations without relying on hardcoded limits.
- Event Correlation: Grouping hundreds of related events across compute, network, and application layers into a single operational incident.
- Causal Reasoning: Analyzing system topology alongside event timelines to present probable root causes to human operators.
4. Incident Management & Contextualization Layer
Once an anomaly is identified and correlated, the system enriches the incident summary with relevant context—such as affected dependencies, recent system changes, and past incident runbooks—before routing the alert to the appropriate AIOps Engineer or SRE team via tools like PagerDuty or ServiceNow.
5. Automation & Remediation Layer
For well-understood, low-risk operational issues, the architecture can initiate automated actions. This includes executing remediation runbooks, scaling resources dynamically, clearing temporary caches, or triggering self-healing workflows via orchestration engines like Ansible or Terraform.
Deep-Dive: Machine Learning in IT Operations
Understanding how algorithms handle operational data helps teams separate practical capabilities from vendor marketing claims.
Dynamic Baselining and Anomaly Detection
Static thresholds fail to accommodate daily or seasonal traffic variations. An e-commerce platform experiences higher transaction loads on Monday afternoons than on Sunday mornings. Machine learning models—such as seasonal Holt-Winters, ARIMA, or unsupervised autoencoders—learn these recurring cycles.
When latencies deviate from the dynamically calculated confidence interval, the system flags an anomaly. This reduces false positives during expected traffic spikes while surfacing critical degradations during low-volume periods.
Topology-Aware Event Correlation
A failing database cluster can cause cascade errors across dozens of downstream microservices, triggering hundreds of downstream alerts. Modern AIOps platforms combine time-series clustering with topology maps. By correlating timestamp closeness with structural dependencies, the analytics engine groups these alerts into a single root incident, suppressing redundant notifications.
Limits of AI in Incident Analytics
Machine learning in AIOps relies entirely on historical data patterns and structural visibility. AI engines cannot predict unprecedented outage causes, reason about unmonitored external dependencies, or evaluate the business context behind unplanned architectural changes without human input. Human oversight remains essential for validating AI-generated insights before executing critical recovery actions.
Comparing Operational Approaches
The structural shift from traditional operations to an AIOps-driven model changes how teams ingest data and manage incidents.
Architectural Dimension
Traditional IT Operations
Observability Pipelines
Modern AIOps Architecture
Data Ingestion
Siloed, per-tool data collection
Centralized telemetry (Metrics, Logs, Traces)
Unified multi-source telemetry, change data, and topology maps
Analysis Method
Static thresholds and manual rules
High-cardinality querying and visualization
Algorithmic pattern recognition, ML, and anomaly detection
Alerting Model
High volume, isolated alert notifications
Visual dashboards and manual query alerts
Correlated incident summaries with context and priority scores
Root-Cause Discovery
Manual log searching across multiple teams
Trace analysis and manual correlation
Topology-aware causal analysis and ML-assisted suggestions
Remediation
Fully manual or basic script execution
Scripted runbooks triggered manually
Guardrailed automated execution with human-in-the-loop fallback
Realistic Architectural Examples
Example 1: Mitigating Alert Storms in Microservices
A financial services firm runs 150 microservices across multiple Kubernetes clusters. An unannounced network switch degradation causes latency between the order service and the user database. Within 60 seconds, 450 distinct alert notifications fire across APM and infrastructure monitoring tools.
AIOps Implementation: An event correlation pipeline ingests the raw alert stream, references the real-time Kubernetes dependency graph, and identifies the degraded network link as the common ancestor. It aggregates the 450 notifications into a single high-priority ticket assigned to the network team, saving hours of manual cross-team triage.
Example 2: Detecting Silent Memory Leaks via Anomaly Detection
A newly deployed code update introduces a gradual memory leak in a critical background worker service. Total memory consumption increases by 1% every hour—well below the static alert threshold of 85%.
AIOps Implementation: The anomaly detection algorithm compares current memory consumption against historical baseline rates. It detects that the trend line violates normal growth characteristics and alerts the platform team days before the application experiences an Out-Of-Memory (OOM) crash.
Designing an Enterprise AIOps Architecture: A 10-Step Framework
Deploying an AIOps framework requires systematic planning around data quality, integration, and operational guardrails.
- Step 1: Assess existing environment. Document current monitoring tools, infrastructure footprints, and team boundaries.
- Step 2: Identify operational pain points. Quantify mean time to detect (MTTD), mean time to resolve (MTTR), and alert noise volumes.
- Step 3: Define measurable objectives. Set target reductions for duplicate notifications and manual triage times.
- Step 4: Collect and standardize data. Establish streaming pipelines to ingest metrics, logs, traces, and deployment events into standard schema formats.
- Step 5: Improve monitoring and observability. Address coverage gaps in telemetry collection before applying machine learning.
- Step 6: Introduce anomaly detection & correlation. Deploy ML models on standardized data streams to group events and surface dynamic baselines.
- Step 7: Integrate incident workflows. Connect the AIOps engine directly into incident management systems (ITSM) and messaging channels.
- Step 8: Automate low-risk responses. Introduce automated remediation for routine, well-understood tasks with clear rollback paths.
- Step 9: Monitor AI recommendation quality. Regularly review model outputs, false-positive rates, and root-cause suggestions with engineering teams.
- Step 10: Continuously evaluate and scale. Expand architectural scope to cover new cloud regions, services, and advanced predictive analytics models.
Security, Governance, and Responsible AI
Integrating AI into core operational workflows introduces security and reliability risks that require clear governance frameworks.
- Data Privacy and Redaction: Operational logs frequently contain sensitive user information, tokens, or IP addresses. The data ingestion layer must sanitize sensitive strings before exposing them to central stores or third-party AI models.
- Automation Guardrails: Automated remediation routines should have strict scope limits (blast-radius controls). High-impact production actions (such as dropping database tables or changing core routing tables) must require explicit human approval.
- Model Explainability: Engine-generated root-cause analyses should explain why a specific component was flagged, providing link traces, correlated metrics, and historical logs so engineers can verify the logic.
- Audit Trails: Every automated operational execution must be logged to an immutable audit trail for compliance, security reviews, and post-incident reviews.
Common Implementation Challenges & Mistakes to Avoid
- Poor Data Quality: Feeding unstandardized, high-cardinality, or incomplete telemetry into an ML model yields inaccurate correlations and high false-positive rates.
- Alerting Over-Automation: Enabling automated remediation workflows without proper testing or guardrails risks turning minor operational anomalies into systemic outages.
- Treating AIOps as a Standalone Tool: AIOps is an architectural capability, not a single software install. Expecting a platform to fix broken operational processes without organizational change leads to failure.
- Ignoring Human Feedback Loops: Failing to provide a mechanism for SREs and operators to mark ML suggestions as "helpful" or "incorrect" prevents the analytics engine from tuning its precision over time.
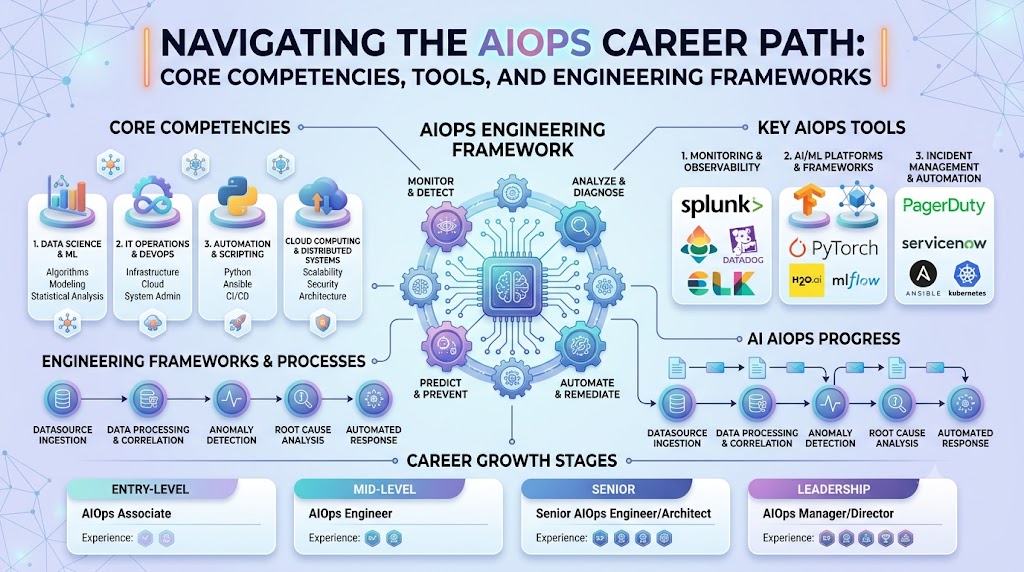
Skills and Career Pathways for AIOps Engineers
As organizations adopt intelligent IT operations, the role of the AIOps Engineer has emerged to bridge the gap between software engineering, data engineering, and systems administration. Building expertise in this discipline involves combining core operational concepts with data-driven methodologies:
- Core Systems Knowledge: Linux administration, networking fundamentals, container orchestration (Kubernetes), and cloud architecture (AWS, Azure, GCP).
- Observability Foundations: Deep understanding of open standards like OpenTelemetry, along with metrics collection, log aggregation, and distributed tracing.
- Data Engineering & Automation: Proficiency in Python or Go, pipeline engineering (Kafka, Vector), automation frameworks (Ansible, Terraform), and basic data science principles.
- AIOps Platforms & Integrations: Experience working with AIOps tools, event correlation engines, and ITSM platforms.
Professionals looking to advance in this field often pursue AIOps Training and structured practical learning paths. When evaluating an AIOps Course or AIOps Certification program, focus on resources that prioritize hands-on labs, telemetry pipeline design, and real-world incident correlation over pure theoretical concepts. Educational platforms like TheAIOps.com offer targeted technical guides, architectural breakdowns, and learning resources designed to help engineers and technology leaders master modern operational automation.
Practical Key Takeaways
- AIOps enhances, not replaces: AIOps builds upon existing observability and monitoring pipelines by adding analytical intelligence, pattern recognition, and automation.
- Data quality dictates success: Clean, standardized, and topology-aware telemetry data is mandatory for accurate ML predictions and effective event correlation.
- Noise reduction is step one: The immediate value of an AIOps architecture lies in filtering duplicate alerts and grouping related signals into unified incidents.
- Human oversight is essential: AI analytics engines provide probabilistic insights. Human engineers must validate complex recommendations and oversee high-risk remediation actions.
- Start small with automation: Begin by automating routine, low-risk operational tasks with established guardrails before attempting complex self-healing workflows.
- Architect for integration: Ensure your AIOps platform connects with your existing CI/CD, ITSM, communications, and cloud infrastructure ecosystem.
Frequently Asked Questions
What is an AIOps Architecture?
An AIOps architecture is a multi-layered functional framework that ingests, standardizes, and analyzes operational data (metrics, logs, traces, events) using machine learning. It reduces alert noise, isolates probable root causes, and automates low-risk operational tasks across complex IT environments.
How does AIOps differ from traditional IT monitoring?
Traditional monitoring relies on static thresholds and manual alerts on individual components. AIOps ingests telemetry across systems, uses dynamic baselining to detect true anomalies, and correlates related events to highlight broader operational issues.
What role does machine learning play in AIOps?
Machine learning algorithms automate pattern recognition, establish dynamic behavior baselines, group correlated alerts based on topology, and suggest probable root causes based on historical system telemetry and change events.
What are the core data sources in an AIOps pipeline?
A complete pipeline ingests metrics, logs, distributed traces, system events, topology maps, network metadata, and application change logs (such as CI/CD deployments and configuration updates).
Can AIOps fully automate incident resolution?
While AIOps can execute automated remediation for routine, low-risk, and well-understood operational issues, complex production incidents still require human engineers for validation and strategic decision-making.
What skills are required to become an AIOps Engineer?
An AIOps Engineer requires a mix of systems engineering, cloud administration, software development (Python/Go), observability engineering (OpenTelemetry), data pipeline management, and familiarity with machine learning analytics.
How do I evaluate AIOps Tools and Platforms?
Evaluate platforms based on data integration capabilities, scalability, support for open standards (like OpenTelemetry), dynamic anomaly detection accuracy, topology awareness, and security guardrails for automation.
What is the difference between Observability and AIOps?
Observability provides the raw visibility and structured telemetry (metrics, logs, traces) needed to understand system state. AIOps applies machine learning and analytics to that telemetry to surface insights, correlate issues, and drive automated outcomes.
How does event correlation reduce alert fatigue?
Event correlation analyzes timestamps, system topology, and failure patterns to group hundreds of related alerts triggered by a single underlying issue into a single, contextualized incident ticket.
Where should an organization begin with AIOps Implementation?
Start by auditing existing telemetry sources, improving foundational observability, and deploying event correlation to address immediate alert noise before attempting advanced predictive analytics or automated remediation.
Conclusion
Designing an effective AIOps architecture is essential for managing the scale and complexity of modern IT infrastructure. By organizing operations around structured data ingestion, algorithmic analysis, contextualized incident management, and safe automation, organizations can significantly reduce MTTR and minimize alert fatigue for SRE and operations teams.Successful adoption requires balancing machine capabilities with human expertise. Prioritizing data quality, robust observability, clear governance guardrails, and continuous learning will yield a resilient, intelligent operational ecosystem.